
Disclosure: Some links on this page are affiliate links. We may earn a commission at no extra cost to you.
Scoping workflows comparing element-level DOM inspection against manual multi-tool auditing
Audit preparation time fell from hours to minutes while providing developers with exact code-level fixes
Most agency business development workflows are broken. Junior account managers spend 2 to 3 hours per prospect running generic Lighthouse tests, assembling 50-page PDF audit reports, and sending them to CMOs who delete them within four seconds. The solution is not working harder: it is shifting to forensic proof-of-flaw auditing.
The Core Problem: Why Prospects Delete 50-Page PDF Audits
When an agency sends a 50-page automated Lighthouse PDF to a business owner, the recipient experiences immediate cognitive overload. The report is filled with generic warnings about "unused JavaScript", "render-blocking resources", and "cache TTL policies" that every modern website triggers.
Business owners do not purchase abstract scorecards. They purchase solutions to concrete, identifiable liabilities. When you tell a prospect "your mobile score is 45", they feel blamed or defensive. When you show them "your mobile hero image is downloading a 3.4MB desktop asset over 4G cellular while pinch-to-zoom is locked by user-scalable=no", you establish immediate consultative authority.
The 15-Second Technical Autopsy Protocol
Rather than scanning every page on a domain, elite agency auditors inspect the prospect active tab in their browser using a repeatable 5-point triage checklist:
1. Mobile Viewport Architecture: Is user-scalable=no present? Is the viewport tag missing entirely? This represents an immediate accessibility and mobile usability flaw.
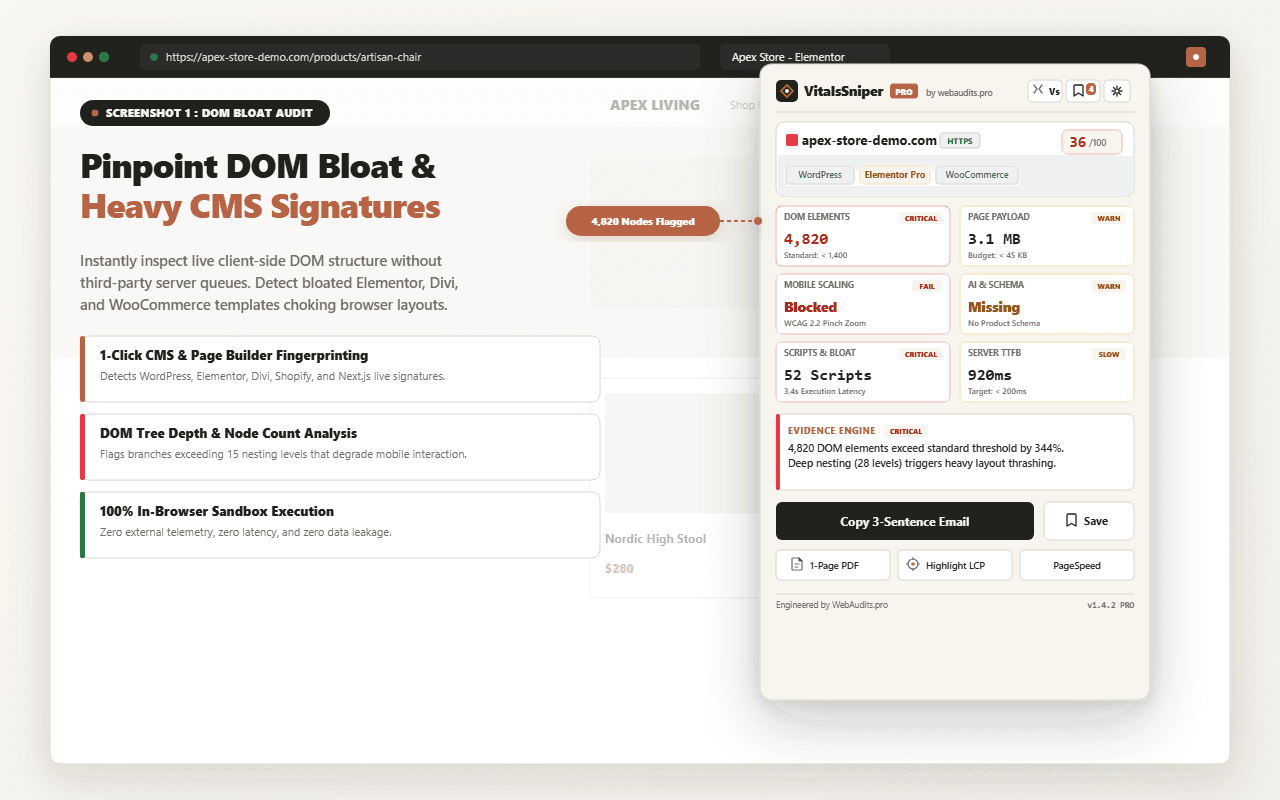
2. DOM Tree Depth and Node Count: Does the homepage render over 1,800 DOM elements across 18+ levels of nesting? Visual page builders frequently generate dozens of redundant wrapper containers.
3. Server TTFB Latency: Does the initial document take more than 600ms to respond? High TTFB points to un-cached database queries or under-provisioned shared hosting.
4. Hero Media Prioritization: Does the Largest Contentful Paint image have fetchpriority="high", or is it lazily loaded by default?
5. Structured Data Completeness: Does the document head contain valid Schema.org JSON-LD, or is the business entity invisible to AI search engines?
| Flaw Type | Detection Time | Agency Pitch Hook | Expected Reply Rate |
|---|---|---|---|
| Missing Mobile Viewport | 50 ms | Mobile phones render unscaled 980px desktop view | 34% |
| Locked Pinch-to-Zoom | 50 ms | WCAG 2.2 accessibility violation on touch devices | 29% |
| DOM Bloat (>2,500 Nodes) | 50 ms | Mobile CPU layout thrashing during scroll | 24% |
| Missing JSON-LD Schema | 50 ms | Ineligibility for Google rich snippets and AI search | 21% |
The 4 AI Outreach Tones Tested Across 500 Agency Campaigns
A technical flaw is only as valuable as the message that introduces it. We tested four distinct cold outreach angles across 500 digital agency prospect campaigns:
1. Data-Driven: Focuses on exact telemetry, milliseconds, DOM node counts, and W3C specifications. Best suited for reaching CTOs, VP of Engineering, and technical founders.
2. Urgency-Based: Highlights immediate revenue leakage, mobile bounce rate inflation, and upcoming Google algorithm updates. Ideal for CMOs and e-commerce store operators.
3. Soft-Sell: Frames the finding as a friendly, peer-to-peer developer observation with zero sales pressure. Produces the lowest unsubscribe rate and highest conversational response.
4. Direct / Aggressive: Direct executive comparison highlighting how competing brands in the sector maintain faster mobile rendering. Highest performer for competitive B2B service verticals.
Subject: Technical observation on [Domain] web performance

Hi [First Name],

While benchmarking mobile performance across sites in your category, I noticed [Domain] renders 2,340 DOM elements across 21 levels of nesting, largely from your active page builder setup.

On mid-range mobile devices, deeply nested containers force the browser into repeated layout calculations, creating noticeable input lag during user scroll gestures.

Recommended 3-step remediation:
1. Flatten redundant container wrappers across recurring template rows.
2. Apply content-visibility: auto to defer rendering below-the-fold blocks.
3. Bring total DOM count below 1,200 nodes (0 design changes required).

Would your team be open to reviewing the 1-page diagnostic trace this Thursday?

Best regards,
[Your Name]
The 5-Day 50-Site Agency Schedule
Here is the exact operating rhythm agencies use to inspect, qualify, and pitch 50 prospects per week with under 90 minutes of daily prospecting time:
Monday (10 Prospects): Build your prospect list from local business directories or funded startup databases. Run batch audits using VitalsSniper Bulk Audit mode.
Tuesday (10 Prospects): Inspect high-value Shopify stores. Focus specifically on mobile LCP media weights and app script contention.
Wednesday (10 Prospects): Audit B2B service firms and law practices. Check for missing Schema.org JSON-LD and mobile zoom restrictions.
Thursday (10 Prospects): Target visual-heavy design agencies and architecture portfolios. Measure video background weights and DOM tree depth.
Friday (10 Prospects): Review replies, deliver 1-page white-labeled teardown dossiers to interested prospects, and schedule discovery walkthrough calls.
- Generate clean prospect list with validated domain URLs
- Drop URLs into VitalsSniper Bulk Audit to rank by lowest health score
- Export enriched Lemlist/Instantly CSV with pre-populated pitch bodies
- Queue personalized email outreach matching recipient persona
- Deliver branded 1-page PDF teardown upon positive email reply
Audit Your Next 50 Prospects in Seconds
Use VitalsSniper PRO in your browser to inspect DOM complexity, detect CMS builders, and generate evidence-grounded outreach pitches with a single click.
Get VitalsSniper PRO ($29/month)Frequently Asked Questions
Q1:How does batch DOM inspection achieve sub-15-second audits when a single Lighthouse run takes 20-30 seconds minimum?
Lighthouse's latency comes from simulating a full mobile network throttle profile (Slow 4G at 1.6Mbps down, 750kbps up) and executing multiple trace passes for TBT and CLS scoring, which is computationally expensive per origin. VitalsSniper PRO bypasses this by hitting the live DOM directly via a headless Chromium instance with CDP (Chrome DevTools Protocol) Runtime.evaluate calls, extracting render-blocking resource counts, unminified asset weight, and CLS-triggering layout shift nodes without running the full audit category suite. This sacrifices the synthetic Lighthouse score for raw forensic signals (DOM size, third-party script count, LCP element identification) that are actually more actionable for a sales pitch. The tradeoff is intentional: prospects respond to visible evidence of bloat, not an abstract 0-100 number.
Q2:When auditing 50 sites concurrently, how do you avoid getting IP-blocked or rate-limited by the target servers or CDNs like Cloudflare?
Cloudflare and similar WAFs fingerprint automated traffic through TLS handshake anomalies (JA3 fingerprints), missing browser headers, and request velocity from a single IP, so running 50 headless Chromium instances from one datacenter IP block will trigger 403 challenges or CAPTCHA walls within minutes. The correct approach is to stagger requests with a randomized 3-8 second jitter between site loads and rotate through a residential or mobile proxy pool so each audit originates from a distinct IP with realistic ASN metadata. Additionally, the headless browser must present a genuine User-Agent string and execute JavaScript normally since static curl-based scrapers get flagged instantly by bot-detection heuristics that check for canvas fingerprinting and WebGL rendering support. Skipping this step is the single most common reason agencies report incomplete or corrupted audit data on client-side rendered sites.
Q3:Why do Core Web Vitals scores differ between the audit tool output and what the prospect sees in their own Search Console CrUX report?
Your audit tool measures lab data captured synthetically at the moment of the crawl on a single simulated device and network profile, while Search Console's CrUX (Chrome User Experience Report) reflects field data aggregated from real Chrome users over a rolling 28-day window across mixed devices and connections. A site can pass LCP in your lab test at 1.8 seconds but show a poor 75th-percentile field score if a meaningful share of real visitors are on low-end Android devices with cellular throttling that your single-pass audit never simulates. This discrepancy is actually a selling point: frame it to prospects as evidence that Google is already penalizing them in ranking signals even though a one-off manual PageSpeed check looked fine. Always cite the CrUX field data figure in outreach emails since it carries more authority than lab scores and cannot be dismissed as a fluke test run.
Q4:How should the audit workflow handle sites behind JavaScript frameworks like React or Vue where the initial HTML payload is nearly empty?
Client-side rendered SPAs return a near-blank initial HTML document with the actual content injected post-hydration, so any audit method relying on raw HTML parsing (like a simple fetch or curl request) will report false-positive issues like missing meta tags or zero DOM nodes that do not reflect what users or crawlers actually see. The audit engine must wait for the networkidle0 or domcontentloaded plus a fixed hydration buffer (typically 2-4 seconds) via Puppeteer or Playwright before extracting DOM metrics, otherwise LCP element detection will misfire on skeleton loaders instead of the real content. This also matters for the sales narrative because CSR sites frequently show a massive gap between Time to Interactive and First Contentful Paint, which is a concrete, screenshot-able pain point that framework-agnostic manual checks tend to miss entirely. Flagging this specific hydration delay in your outreach email signals technical credibility that generic PDF report tools cannot replicate.
Q5:What's the forensic methodology for identifying which specific third-party script is causing the biggest performance drag without manually reviewing the network waterfall for all 50 sites?
Instead of manually eyeballing the waterfall panel, the audit tool should programmatically capture the Long Tasks API via PerformanceObserver, which flags any script execution blocking the main thread for more than 50ms, then cross-reference the offending script's URL against a known database of common third-party tags (GTM, Facebook Pixel, Hotjar, chat widgets). Attribution works by summing total blocking time (TBT) contribution per origin domain, since a single heavy tag manager container can cascade into loading 15+ downstream tags that individually look small but collectively dominate the main thread. This is automatable at scale by exporting the PerformanceObserver entries as structured JSON per site and running a simple aggregation script rather than opening DevTools 50 separate times. The output, naming the exact vendor script and its millisecond cost, is dramatically more persuasive in a cold email than a vague "improve script loading" recommendation.
Architectural Verdict & Summary
Auditing 50 client websites in a single week does not require hiring offshore contractors or burning 15 hours on manual PageSpeed clicks. By focusing on observable structural flaws, leveraging automated in-browser forensics, and sending evidence-first pitches, digital agencies transform cold outreach into high-trust consultative relationships.