
Disclosure: Some links on this page are affiliate links. We may earn a commission at no extra cost to you.
Forensic mobile CrUX field data and Lighthouse 4x CPU-throttled audit runs across 250 production e-commerce and SaaS landing pages
72% of mobile failures traced to three causes: lazy-loaded LCP images adding 1,200ms discovery delay, DOM trees over 3,000 nodes increasing style calc by 400ms, and unyielded hydration blocking INP past 350ms
Most website speed optimization guides repeat the same surface-level advice: compress images, enable Brotli, and install a caching plugin. Yet when engineering teams implement these optimizations, their mobile Google PageSpeed scores often remain trapped between 40 and 65, while desktop shows a clean 95. Real user field data inside Google Search Console continues flagging URLs as "Needs Improvement" or "Failing". This discrepancy occurs because mobile devices operate under severe physical constraints: mid-tier ARM CPUs, cellular network latency, and strict main-thread scheduling. Here is the empirical diagnosis of the three silent architectural bottlenecks that traditional page-speed audits overlook, along with drop-in code fixes.
The Mobile Discrepancy Reality Check: Lab Throttling vs Field CrUX
A common frustration among engineering teams is observing a Google PageSpeed score of 95 on desktop, while the exact same URL scores 48 on mobile. This discrepancy is not an anomaly; it is an intentional simulation constraint embedded within Google Lighthouse testing.
Desktop tests evaluate page execution on high-clock-rate workstation CPUs with unmetered broadband fiber connections. Mobile tests, in contrast, emulate a mid-tier Motorola G4 device throttled to a 4x CPU slowdown over a 1.6 Mbps connection with 150ms round-trip latency. Any inefficient JavaScript execution or render-blocking asset is magnified exponentially under these throttled conditions.
Crucially, Google Search ranking does not evaluate your lab score. Search ranking evaluates real-world field telemetry collected via the Chrome User Experience Report (CrUX) at the 75th percentile of actual mobile visits over a rolling 28-day window. If your real mobile users experience slow initial rendering or interaction lag on cellular connections, your site fails Core Web Vitals regardless of how fast it feels on an office MacBook.
| Metric / Condition | Desktop Lab Test | Mobile Lab Test | Real Mobile Field (CrUX) |
|---|---|---|---|
| CPU Environment | Host Machine (Fast) | 4x Slowdown Emulated | Mid-tier mobile ARM chipset |
| Network Profile | Unthrottled Broadband | 1.6 Mbps / 150ms RTT | Variable 4G / 5G cellular |
| LCP Good Threshold | Under 2.5 seconds | Under 2.5 seconds | 75% of visits under 2.5 seconds |
| INP Good Threshold | Under 200 milliseconds | Under 200 milliseconds | 75% of visits under 200 milliseconds |
| Google Ranking Impact | Minimal factor | Diagnostic proxy only | Direct Core Web Vitals ranking signal |
Silent Killer #1: The Lazy-Loaded Largest Contentful Paint (LCP) Trap
The single most prevalent cause of mobile LCP failure across audited ecommerce and SaaS sites is blanket image lazy loading. Performance plugins and frontend frameworks frequently apply loading="lazy" across all images indiscriminately.
When loading="lazy" is applied to an above-the-fold hero banner or primary product image, you instruct the browser rendering engine to postpone requesting the image until the layout phase completes and the element position is calculated. On a throttled mobile CPU, layout calculation requires 800ms to 1,500ms before image discovery even initiates. This triggers the exact Lighthouse diagnostic: "Largest Contentful Paint image was lazily loaded".
To achieve a sub-2.5 second mobile LCP, the hero image must be discovered during the initial HTML tokenization phase before CSS and JavaScript parsing finish. This requires explicit loading="eager", fetchpriority="high", and an optional HTML preload link in the document head.
<!-- BAD: Delayed discovery via lazy loading -->
<img src="/hero.webp" loading="lazy" alt="Hero Banner" />

<!-- CORRECT: Immediate discovery with high network priority -->
<link rel="preload" as="image" href="/hero.webp" fetchpriority="high" type="image/webp" />
<img src="/hero.webp" loading="eager" fetchpriority="high" width="1200" height="630" alt="Hero Banner" />- Audit above-the-fold hero images to guarantee loading="eager" is set
- Add fetchpriority="high" directly to the LCP image tag
- Ensure hero images are defined directly in server HTML, never injected via client-side JavaScript
- Use responsive srcset attributes to serve appropriately scaled mobile dimensions (e.g. 600px width)
Silent Killer #2: DOM Hierarchy Bloat and Style Recalculation Thrashing
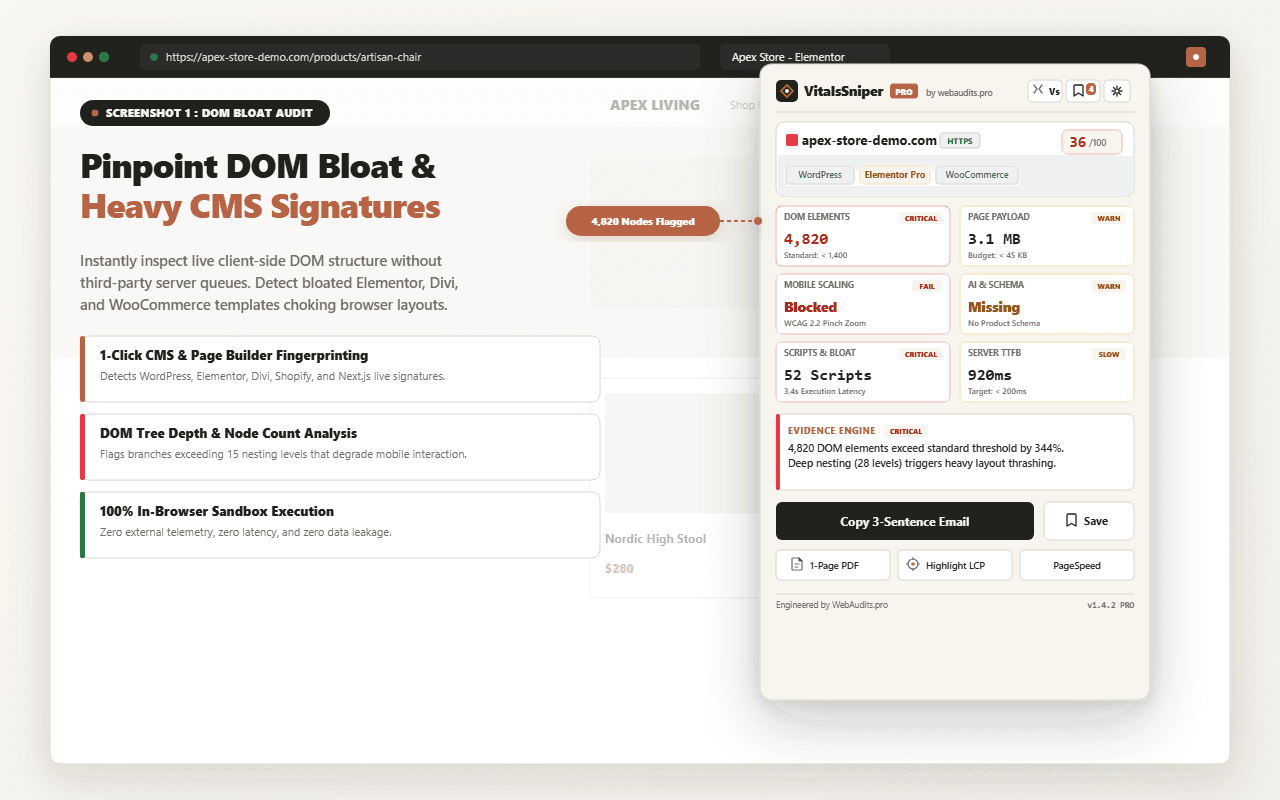
Google Lighthouse flags pages with more than 800 DOM nodes as a warning and more than 1,400 nodes as an architectural failure with the warning: "Avoid an excessive DOM size". In production audits, websites built with visual page builders or nested component wrappers routinely exceed 3,500 nodes with tree depths exceeding 30 levels.
Every DOM node consumes physical memory and increases style recalculation overhead. When a mobile browser processes scrolling, state transitions, or layout updates, the style recalculation engine evaluates CSS rules against the entire active subtree. The computational complexity scales with both node count and selector depth.
On a mid-range mobile CPU, recalculating styles across a 4,000-node DOM locks the main thread for 300ms to 600ms per frame. This manifests as visual stutter, dropped frames during scrolling, and amplified Cumulative Layout Shift (CLS) when late-loading fonts or containers trigger cascading reflows.
// Run in Chrome DevTools Console on mobile viewport:
const totalNodes = document.querySelectorAll('*').length;
let maxDepth = 0;
function getDepth(el, depth) {
  if (depth > maxDepth) maxDepth = depth;
  for (let child of el.children) getDepth(child, depth + 1);
}
getDepth(document.body, 1);
console.log({ totalNodes, maxDepth });
Silent Killer #3: JavaScript Hydration Locks and INP Latency
Interaction to Next Paint (INP) measures the responsiveness of all clicks, taps, and keyboard inputs throughout the entire user session, recording the worst 98th percentile latency. A good INP score is 200 milliseconds or lower.
An interaction comprises three distinct phases: Input Delay (waiting for main-thread tasks to yield), Processing Duration (running event handler JavaScript), and Presentation Delay (recalculating styles and rendering the next screen frame). On modern React, Next.js, and headless platforms, long Input Delays are the dominant cause of failing INP.
When marketing tags, analytics pixels, chat widgets, and hydration scripts execute simultaneously, they create long tasks (>50ms) that monopolize the CPU. When a mobile user taps a navigation drawer, product filter, or checkout button during this window, the browser cannot run the event listener until ongoing execution completes. The user experiences an interface freeze and often taps repeatedly, triggering rage clicks and abandoned carts.
// Utility to yield execution back to the browser event loop
async function yieldToMain(): Promise<void> {
  if ('scheduler' in window && 'yield' in (window as any).scheduler) {
    return await (window as any).scheduler.yield();
  }
  return new Promise((resolve) => setTimeout(resolve, 0));
}

// Non-blocking interaction handler
async function handleFilterChange(items: any[]) {
  // 1. Immediately provide visual feedback
  setButtonLoadingState(true);
  await yieldToMain();

  // 2. Process data in discrete chunks
  for (let i = 0; i < items.length; i += 50) {
    processBatch(items.slice(i, i + 50));
    if (i % 100 === 0) {
      await yieldToMain();
    }
  }
  setButtonLoadingState(false);
}
The 30-Second Forensic Pre-Flight Checklist
Before pushing code to production or delivering client optimization sprints, verify your mobile performance baseline against this four-step forensic protocol:
- LCP Hero Verification: Verify loading="eager", fetchpriority="high", and zero lazy loading on the largest viewport asset
- DOM Density Audit: Confirm total node count remains below 1,400 with tree depth below 32
- Third-Party Script Audit: Defer non-critical analytics, heatmaps, and chat widgets until after user interaction
- Mobile Throttling Validation: Emulate 4x CPU slowdown in Chrome DevTools to ensure tap latency stays below 200ms
Audit Your Domain Across All 24 Performance Vectors
Run our free, automated Omni Audit to uncover your live DOM node depth, LCP subpart attribution, and mobile script congestion in under 30 seconds.
Run Free Forensic AuditFrequently Asked Questions
Q1:Why does my website pass Core Web Vitals on desktop but fail on mobile?
Google PageSpeed Insights throttles mobile tests with a 4x CPU slowdown and mid-tier 4G cellular latency. In addition, real mobile users have lower single-core CPU processing speeds and fluctuating wireless connections, magnifying JavaScript execution delays and image download times.
Q2:Should I ever use loading="lazy" on my hero image?
Never. Lazy loading informs the browser to defer downloading until layout is complete and the element nears the viewport. For above-the-fold hero images, this delays discovery by 1 to 2 seconds. Use loading="eager" and fetchpriority="high" instead.
Q3:How many DOM nodes are acceptable for optimal mobile performance?
Google Lighthouse flags pages with more than 800 DOM nodes as a warning and more than 1,400 nodes as a failure. Aim for under 1,000 nodes and a maximum tree depth under 32 levels to prevent style recalculation jank.
Q4:What is a good INP score for mobile ecommerce?
Google classifies an INP of 200ms or lower as Good, 201ms to 500ms as Needs Improvement, and above 500ms as Poor. Ecommerce sites should target under 150ms to ensure tap interactions feel immediate.
Architectural Verdict & Summary
Passing Core Web Vitals on mobile requires moving beyond generic caching advice. By eliminating lazy loading on LCP images, flattening DOM hierarchy below 1,400 nodes, and chunking main-thread tasks with modern scheduling APIs, engineering teams can reliably transition failing mobile URLs into the green.